1.INTRODUCTION
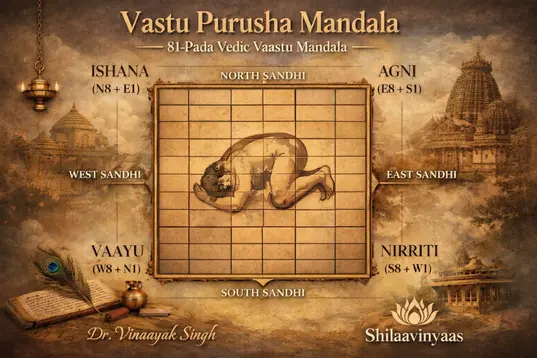
Vaastu is that ancient Engineering dedicated to house building which was somehow lost during modernization of cities. However, recently, it is gaining more predominance. However, it can be seen this field has also been misguided most. This document shows the suggested format to be used to grid our house, plot or any factory/Office in consideration. This gridding is base of any Vaastu. We use 81 cell division also called as 81 padvinyaas. This gives us unequal division methodology with accurate division of zones.
Currently in Market, most of the followers of some big Vastu Gurus uses angular methodology to grid the house. Here they use equal division method i.e. divide the Entire Circle of 360 degree into 16 Zones = 360/16 = 22.5 and further half it to get 32 Entrances which is 22.5/2 = 11.25. This however is wrong methodas this will never give perfect result and result of which some zones will be lowered or above the Energy flow grid.
This Paper aims to provide correct methodology to grid the house. This will help professional Vastu Consultants to follow right gridding approach & hence provide correct consultation to their clients.
2. The Existing Wrong approach widely followed:
In the existing method, a set of Vastu Consultant used 81 Cell Division method to convert it into angular. In 81 Cell, A perfect Square is divided into 9 x 9 grid and if we count the number of outer entrances then it comes out to be 32.

Figure 1 Cell Division using 9 x9 grid = 81 Padvinyaas
The next step they did was divide this 32 parts equally in a circle. So 360/32 = 11.25 degrees. This gridded tool they named it as Shakti Chakra. And today it is very widely and blindly used by many Vastu consultants. The result is shown below:

Figure 2 Wrong Way of Gridding
The Question that comes to mind will be why this approach is wrong. The answer to this is: When we draw Bar chart to represent the areas of this 16 Zones, we will find, We never get perfect bar chart where energies are balanced. Even if we take Square Plot with exact 0 deg North, still we will have some zones below minimum energy line and some zones above maximum energy line which is against the Principal of Vastu described in our classic text. The Original vedas1 suggest Square house with perfect North is perfect. However, if we do zone division by above method, then the area Barchart comes as below:

Figure 3 Energy Flow Chart for Square Plot with 0 deg North
Above, we can see by equal division of zones, some areas will always be below min. energy flow line and some above the Max. energy flow line. However, in case of Perfect house all zones should be within the given range. However, with equal division method, this never happens.
The next Wrong thing in above Methodology is if we see Figure 2, then we can see N5 is from 0 deg to 11.25 Deg.

Figure 4 N5(Soma Energy Field) in Wrong degrees
However, if we see ancient texts1, then we can see in Figure 5 below, 4 Zones comes on right side of North, 4 Zones on left side of North & one center cell is divided in half.

Figure 5 Vedic Method of Gridding Square Plot
So, 0 Degree should divide N5 into 2 parts, whereas in above circular grid, we see N5 is completely on Right side of North.
Unfortunately, today most of the Vastu Practitioner follow this wrong method without going into details. In the next section, we will see how to find the correct way.
3. The Correct way of gridding:
Our ancient text1 mainly says about Square Plot with 0-degree North. However, in today’s modern cities, there is lot of space constraint so square house is not always feasible. Hence Many times Rectangle or tilted house comes into play.
We will divide this topic into two parts. In 1st part, let’s consider rectangular plot with 0 degree North.
Find the center of rectangular plot & create square grid taking into account lower dimension as show in in figure.

Figure 6 Step 1: Rectangular Plot Gridding.
Now, extend the lines from center so it cut the corner of the plots like shown below:

Figure 7 Step 2: Extend the grid lines to corner of plot
In above figure, we can see for example red marked E3 changed the dimensions as shown. This is how, we can grid the rectangular plot with perfect North at 0 degree.
The above example, we can repeat with different size of square plot. In all the cases, we can see that the angles remain the same. These angles are not equal and definately not 360/16 = 22.5
The angles as plotted from CAD system shows the exact degrees which are as below:

Figure 8 Correct Degrees of Each Zone.
From the above Figure, we can see those degrees are:
![]()
![]()
From above we can see division of zones are having unequal degrees. Now to test, we will take the above degrees and create bar chart. We take same square plot as we did in section 2 of this paper.

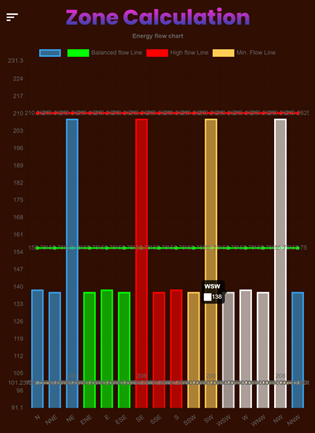
The result of bar chart is as shown below:

Figure 9 Correct Bar Chart using unequal division
The above calculation can be done freely using: https://app.shilaavinyaas.com/energyflow
In this example, we can see all zones are within minimum & maximum energy flow lines.
Moreover all 12 Zones are having equal values unlike what we saw previously.
The reason for 4 zones having more energy is these are corner zones. If we see our vedic text, we can see that the corner zones are governed by 2 energy fields each. This is logical as well because corners needs to be more strongly managed to protect it.
Hence we can see that we should not use equal division but we should follow the unequal division. This helps to get the correct result.
Based on these Degrees, when we draw the Energy Flow tool, it comes out as below:

Figure 10 The Correct Energy Zone Gridding Tool
To ease the use, we have implemented this algorithm in our free to use tool. Where you can enter the values and get all the zone calculations & gridding within minutes for free.
3. CONCLUSIONS
We first saw the current widely used but incorrect way of gridding the Vaastu zones. Step by step we saw what and why it is wrong. We then progressed to correct way of working & shared correct formula including all different values to see how we get correct result. Hence it is advised to all Vastu Practitioner and general masses using Vastu to follow this correct method & benefit from our ancient science.
Attached below you will find AutoCAD file for Zone division. In case if you are looking for transparent png file, then go in Albums & download it for free.
REFERENCES
1. The Brihat Samhita of Varaha Mihira Translated in English by N. Chidambaram in year 1884.
I have habit of reading classical texts. Hence in case if someone wants to read above book for free, he can visit our Knowledge Base section of our app and read the above books along with many other books for free. https://app.shilaavinyaas.com/library
Here is short video on how to use 81 padvinyaas tool for free:
Leave a comment
Your email address will not be published. Email is optional. Required fields are marked *


